
Master the Market: A Guide to TAM SAM SOM for Product Leaders
Master market sizing with our guide on TAM, SAM, and SOM. Learn how to calculate your total addressable market and prioritize your product roadmap with data-backed insights. Read more!


Table of Contents
Calculating TAM SAM SOM is the foundation of any viable product strategy because it defines the total revenue opportunity and the realistic market share your team can capture. Understanding these layers allows product managers to move beyond "gut feelings" and toward data-backed roadmaps that align with investor expectations and internal growth targets. This article covers how to define these metrics, why they matter for product-led growth, and how to use them to prioritize your feature backlog effectively.By mastering the breakdown of your market, you gain clarity on where to focus your limited resources for the highest return on investment. We will explore the nuances of each category, from the broad industry horizons down to the customers you can actually sign today. Whether you are launching a new MVP or scaling a mature platform, these figures serve as your North Star for strategic decision-making.
What is TAM SAM SOM and How to Calculate It
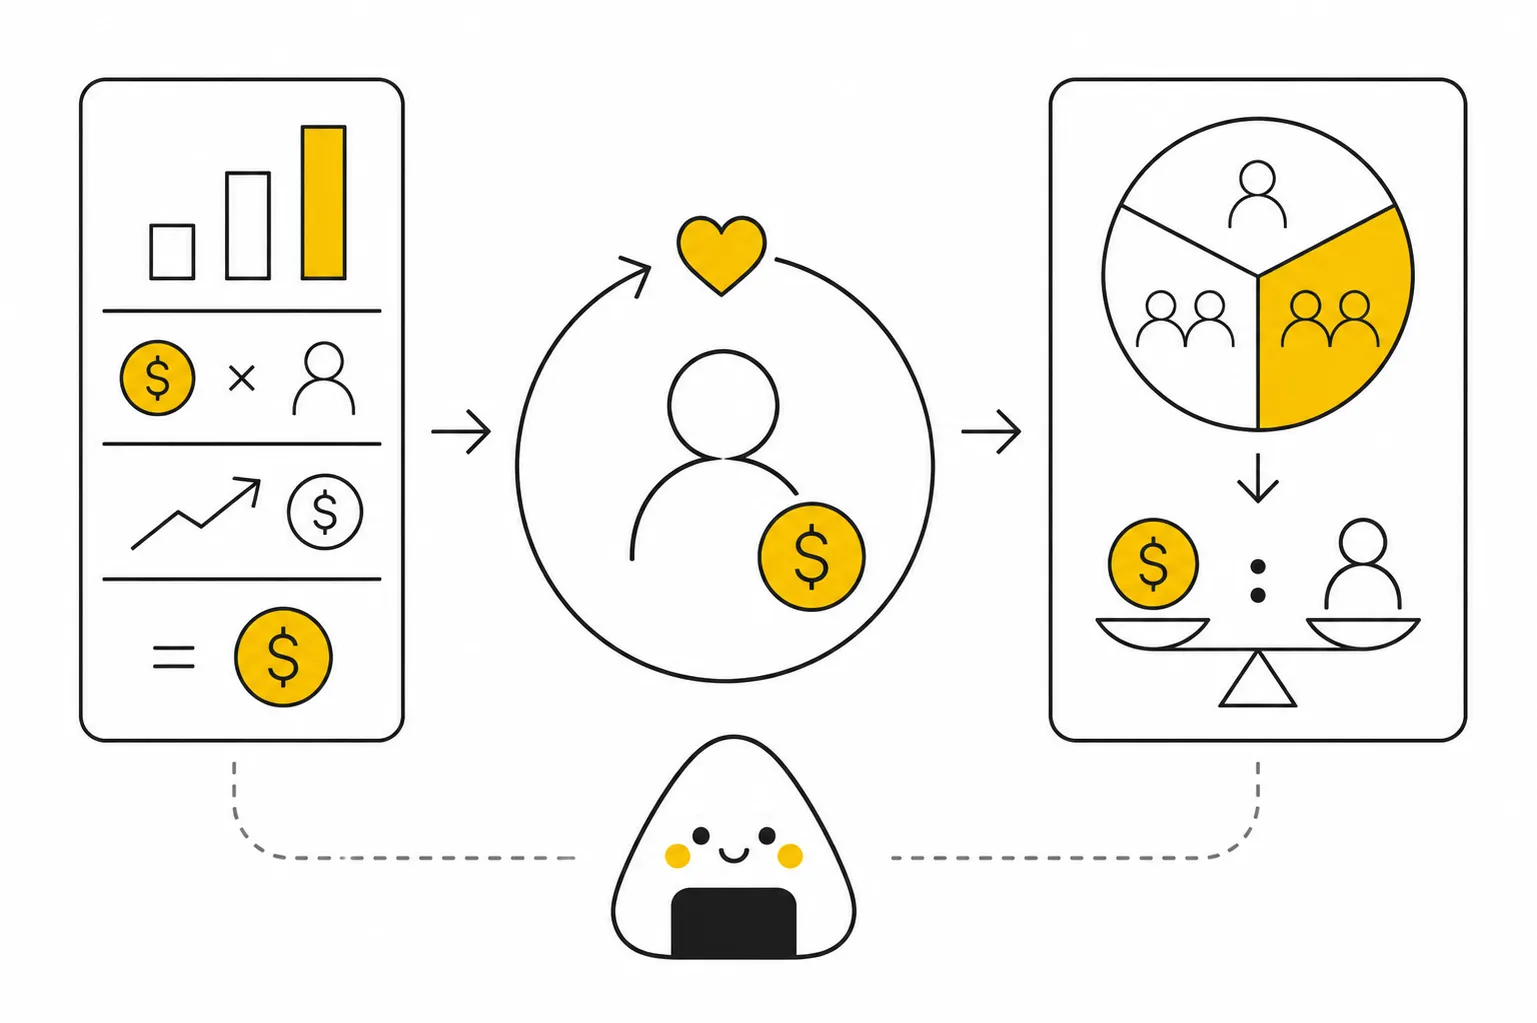
The first step in market sizing is understanding what is TAM SAM SOM in the context of your specific product category and geography. These three acronyms represent a nested hierarchy of market potential, starting with the broadest possible audience and narrowing down to your immediate target. To calculate these accurately, product teams typically use either a top-down approach (using industry research reports) or a bottom-up approach (using internal data and average contract values).
TAM stands for Total Addressable Market, which represents the entire global demand for a product or service if you had 100% market share with no competition. For a B2B SaaS company, this might be every business globally that uses cloud-based accounting software. While you will never capture the entire TAM, defining it helps stakeholders understand the ultimate "ceiling" of the industry you are playing in.
To make these numbers actionable for your daily product operations, consider the following breakdown of how these metrics function in your strategy:
- Total Addressable Market (TAM): This represents the absolute maximum revenue potential. It is best used for defining your long-term vision and communicating the massive scale of the opportunity to investors.
- Serviceable Addressable Market (SAM): This is the portion of the TAM that fits your current business model, geography, and technology stack. It is the primary metric for strategic planning and determining when to move into new regional markets.
- Serviceable Obtainable Market (SOM): This is the slice of the SAM that you can realistically capture within the next 1–3 years. It accounts for your current competition and sales capacity, making it the most important figure for setting quarterly sales targets and roadmapping.
At Product People, we’ve found that many teams focus too much on the TAM to impress investors while neglecting the SOM, which is where the actual product-market fit is proven. By shifting focus toward the SOM, you can identify the specific user pain points that, when solved, lead to immediate revenue. This level of granularity is essential when you are trying to link product analytics and user feedback to product improvements to drive incremental growth.
Identifying Your Target: SAM and SOM in Practice
Once you have defined your global ceiling, the real work begins by identifying the specific segments you can serve. SAM stands for Serviceable Addressable Market, and it is the most critical metric for product managers looking to expand their reach. If your TAM is "all global retailers," your SAM might be "mid-sized e-commerce retailers in Western Europe." This distinction prevents you from spreading your engineering resources too thin across features that only 1% of the total market actually needs.
Refining this further, SOM stands for Serviceable Obtainable Market. This is your "battleground" market. It accounts for the fact that you won't win every deal against established incumbents. To calculate SOM, you must look at your current sales velocity, your marketing budget, and your product’s unique value proposition. According to research on startup metrics from Andreessen Horowitz, focusing on the obtainable market is what allows companies to build a repeatable sales motion before attempting to scale to the broader SAM.
When you align your product roadmap with your SOM, you ensure that every feature shipped has a direct path to revenue. This disciplined approach is often highlighted in McKinsey’s research on the new growth game, which emphasizes that winners in the digital economy are those who dominate specific niches before expanding. By the time you are ready to move from your SOM to the rest of your SAM, you will have the capital and the customer advocacy needed to sustain that growth.
For those in the early stages of product development, using a market sizing framework can help bridge the gap between abstract numbers and a concrete list of target accounts. Remember, a smaller SOM that you can dominate is far more valuable than a massive TAM that you can't even touch.
FAQs
Conclusion
Defining your TAM, SAM, and SOM is not just a math exercise for a slide deck; it is a vital strategic tool for product management. By understanding the boundaries of your market, you can make more informed decisions about feature prioritization, resource allocation, and long-term scaling.
Start by validating your SOM with real user data and sales results. Once you have established a foothold, use that momentum to expand into your SAM, and eventually, work toward your broader TAM vision. This phased approach ensures sustainable growth and helps your team stay focused on delivering value to the customers you can serve best.

Interested in working with us?
Our Interim/Fractional Product Managers, Owners, and Leaders quickly fill gaps, scale your team, or lead key initiatives during transitions. We onboard swiftly, align teams, and deliver results.
Read More Posts
June 29, 2026
CPO Meaning: What Is a Chief Product Officer?
A CPO (Chief Product Officer) is the most senior product role in a company. Learn the CPO meaning, job description, and when a fractional CPO makes sense.

June 26, 2026
What Is a Product Definition? A Guide for Product Managers
Learn what a product definition is, what it should include, and how it applies to MVPs, digital products, and data products.
June 12, 2026
Customer Lifetime Value: What It Is and How to Grow It
Learn what customer lifetime value is, how to calculate it with the CLV formula, and proven strategies to increase CLV for your SaaS business.