
The Product Adoption Curve: A Strategic Guide for Product Leaders
Master the adoption curve to scale your product. Learn how to navigate the 5 adopter segments, cross the chasm, and drive mainstream growth with expert insights.


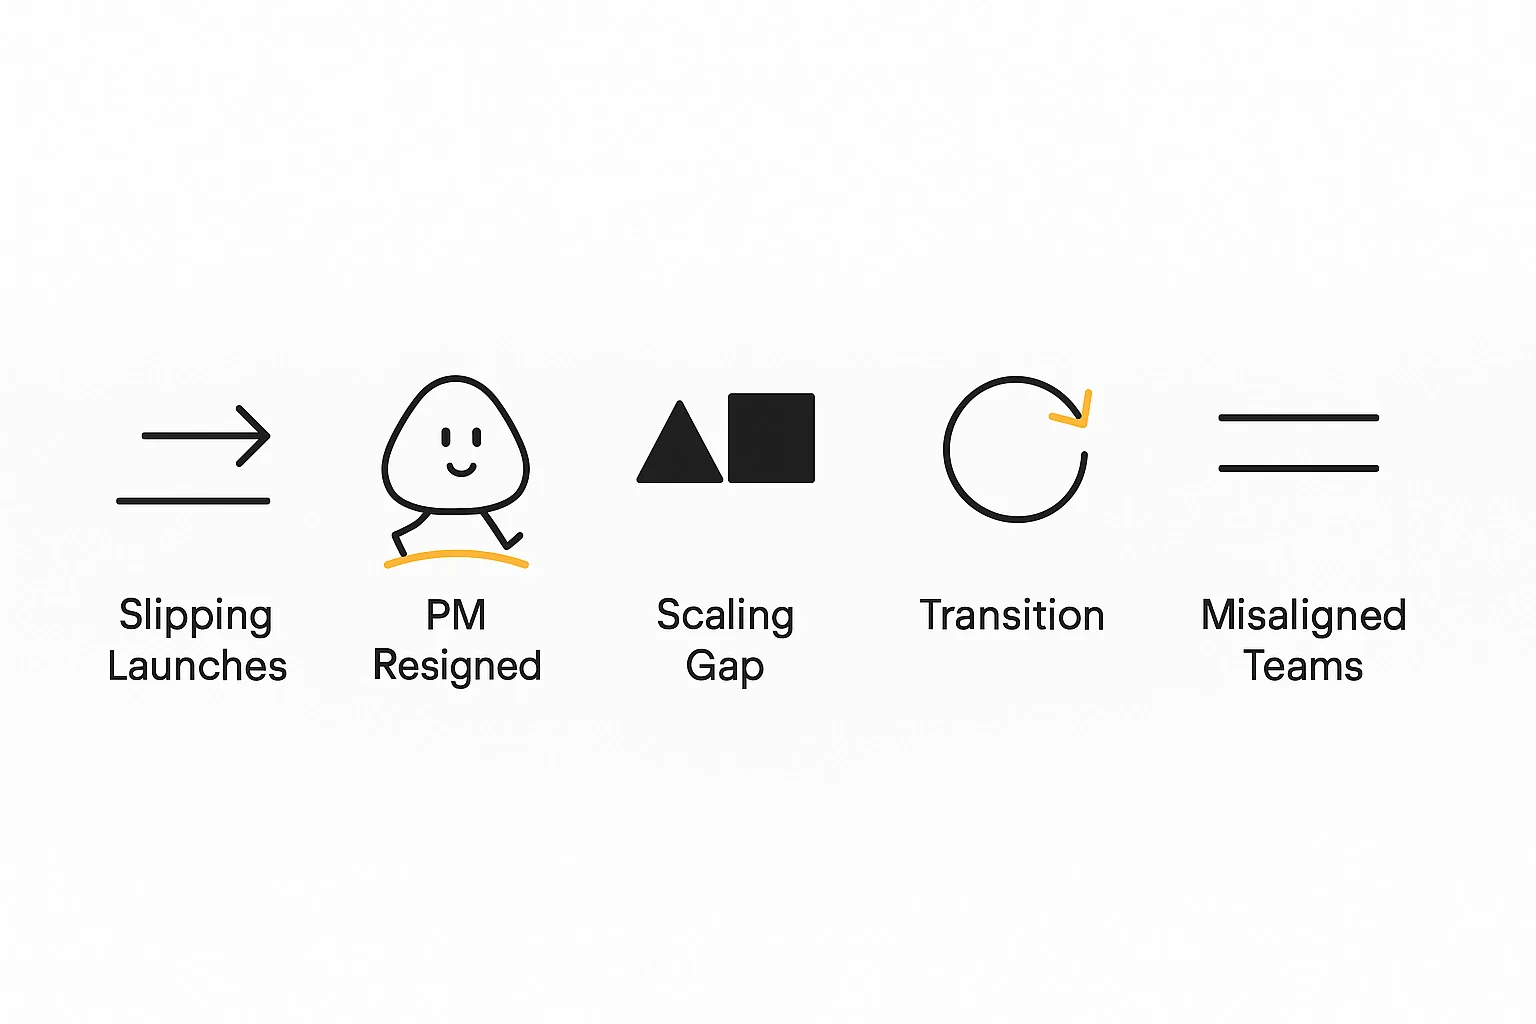
Table of Contents
Master the Adoption Curve: A Strategic Guide for Product Leaders
The adoption curve is a sociological model that describes how different groups of people accept and use a new product or technology over time. For product managers, understanding this distribution is the difference between a successful launch and a product that plateaus before reaching the mainstream. It visualizes the journey from the first brave "innovators" to the skeptical "laggards," providing a roadmap for how to adjust your product strategy, messaging, and features as your user base grows.
In this guide, we will break down the mechanics of the curve and how to navigate the specific challenges of each segment. By mastering this framework, you can anticipate market shifts, allocate resources more effectively, and ensure your product doesn't just start strong, but sustains growth throughout its entire lifecycle. We’ll cover the psychological drivers behind each adopter group and provide actionable tactics for scaling across the segments.
Navigating the Technology Adoption Curve for Scalable Growth
Understanding the technology adoption curve is vital because a product's value proposition must evolve as it moves through different market segments. When we work with clients at Product People, we often see teams make the mistake of using the same marketing and feature set for early adopters and the early majority. In reality, these groups have fundamentally different needs. Innovators and early adopters are looking for a competitive advantage and are willing to tolerate bugs or a lack of polish to get it. However, once you hit the "chasm" before the early majority, the requirements shift toward reliability, social proof, and seamless integration.
To successfully cross this gap, product leaders must pivot from selling a "vision" to selling a "solution." This requires a deep dive into user personas to identify the specific pain points that resonate with pragmatic buyers. For example, during our work driving early adoption for Lokalise’s Shopify translation app, we focused on identifying high-intent users who needed immediate results, which allowed us to build the necessary momentum to reach a wider audience.
Growth isn't linear; it's a series of transitions. You must identify the "beachhead" market, a small group of users within a segment that you can dominate, before expanding. This focus ensures that your development team isn't spread too thin trying to please everyone at once. By documenting the specific requirements of each stage, you can create a product roadmap that mirrors the psychological shift from risk-taking to risk-aversion that characterizes the broader market.
Optimizing the Product Adoption Curve and User Retention
The product adoption curve is not just a theoretical chart; it is a diagnostic tool for your product-market fit. While Everett Rogers originally popularized the innovation adoption curve in his 1962 book, Diffusion of Innovations, its application in modern SaaS and digital products has become more complex due to the speed of information. Today, the "diffusion" of an idea happens at lightning speed, but the psychological barriers to entry remain the same. The original research on the diffusion of innovations highlights that adoption is a social process where "trialability" and "observability" are key factors in how fast a product spreads.
In our experience as interim product leaders, we frequently encounter "The Chasm," a concept famously detailed by Geoffrey Moore. This is the perilous gap between the visionary early adopters and the pragmatic early majority. A common scenario we faced at a B2B SaaS company involved a product that had great initial traction but stalled at the 10% market share mark. We realized the product was too complex for the "pragmatists" who wanted a "whole product" solution rather than a set of powerful but disconnected features. We shifted the focus toward building out integrations and a simplified onboarding flow. This transition helped the client cross the chasm by reducing the perceived risk for new users, eventually leading to a 40% increase in month-over-month sign-ups from mainstream enterprises.
To maximize the Rogers adoption curve segments, consider these tactical shifts:
- Innovators (2.5%): Offer early access to beta features and direct lines to the product team. They value being first.
- Early Adopters (13.5%): Provide case studies and "visionary" content. They want to know how your tool makes them leaders in their field.
- Early Majority (34%): Focus on ease of use, security certifications, and robust customer support. They need to know the tool "just works."
- Late Majority (34%): Emphasize affordability and the fact that "everyone else is using it." They adopt out of necessity or fear of being left behind.
- Laggards (16%): Keep interfaces familiar and minimize changes. They only adopt when there is no other choice.
Monitoring these segments through cohort analysis allows you to see where users are dropping off. If your "early majority" isn't sticking around, it’s a sign that your core value proposition might be too technical or your onboarding isn't sufficiently streamlined. Continuous research into how different demographics adopt technology can also provide clues into how to tailor your UI/UX for older or less tech-savvy populations, which often make up the later stages of the curve.
FAQs
Conclusion
Mastering the adoption curve is an essential skill for any product professional aiming for long-term market dominance. By recognizing that different segments of your audience require different engagement strategies, you can avoid the common pitfalls that cause many promising innovations to fail prematurely.
Whether you are just starting with innovators or trying to win over the late majority, remember that empathy for the user’s specific context is your greatest asset. Keep iterating, stay focused on the "whole product" experience, and use these frameworks to guide your product toward sustainable, mainstream success.

Interested in working with us?
Our Interim/Fractional Product Managers, Owners, and Leaders quickly fill gaps, scale your team, or lead key initiatives during transitions. We onboard swiftly, align teams, and deliver results.
Read More Posts
July 31, 2026
What Great Product Manager Hiring Actually Looks Like: A Conversation Between Product People & Delivery Hero
Product People and Delivery Hero share what actually predicts a great Product Manager hire, from live case studies to the one interview question worth stealing.
July 30, 2026
Go-to-Market Strategy: Framework, Steps, and Examples
What is a go-to-market strategy? Learn the framework, the building blocks, and a real example before your next launch.
March 25, 2026
Understanding the Modern User to Drive Product Growth
Dive into user experience by moving beyond basic metrics. Learn how to build a robust user persona definition, utilize a professional user persona template, and analyze real-world user persona examples to drive product-led growth and retention.