The Comprehensive Guide to How NPS is Calculated for Product Growth
Master how NPS is calculated with our expert guide for product teams. Learn the net promoter score formula, interpret score ranges, and turn data into growth.


Table of Contents
The Comprehensive Guide to How NPS is Calculated for Product Growth
How NPS is calculated is a fundamental question for product managers who need to quantify customer loyalty through a single, actionable metric. To find the result, you subtract the percentage of "Detractors" from the percentage of "Promoters" based on a survey that asks users how likely they are to recommend your product on a scale of 0 to 10. While the math itself is straightforward, the strategic implications for product development and user retention are profound.This guide explores the mechanics behind the Net Promoter System, moving beyond the surface-level arithmetic to examine how product teams use these insights to drive roadmap decisions. We will cover the specific categories of respondents, the benchmarks for success across different industries, and the practical steps for implementing this metric within your existing product lifecycle. By understanding the nuances of the calculation, you can transform a simple number into a powerful engine for organic growth and long-term customer satisfaction.
Measuring Loyalty and Understanding What the NPS Score Is
To understand the broader context of customer sentiment, we must first define what the NPS score is in the world of modern product management. The Net Promoter Score (NPS) is a gold-standard metric used to gauge the loyalty of a firm's customer relationships, serving as an alternative to traditional customer satisfaction research. It was popularized by Frederick F. Reichheld in his 2003 Harvard Business Review article, The One Number You Need to Grow, which established the correlation between high scores and sustainable company growth. In the product realm, it acts as a high-level health check, signaling whether your user base is likely to promote your product via word-of-mouth or actively steer potential users away.
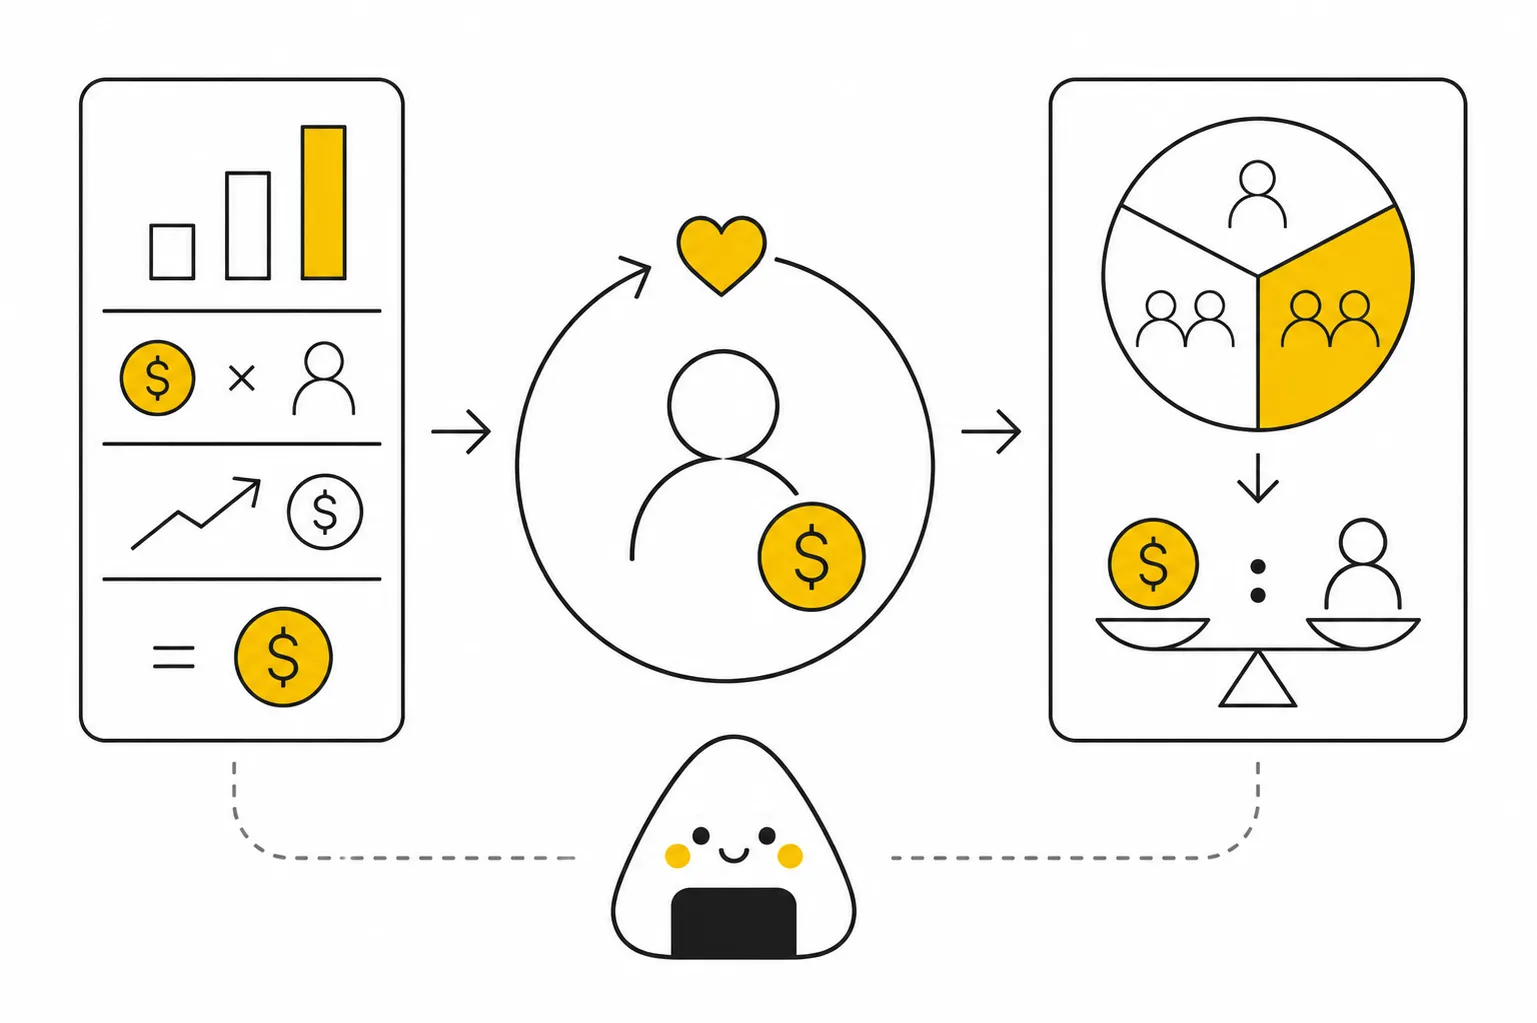
The calculation begins with a single survey question: "On a scale of 0 to 10, how likely are you to recommend our product/service to a friend or colleague?" Based on their responses, users are grouped into three distinct buckets.
- Promoters (score 9-10) are your most loyal enthusiasts who will keep buying and referring others.
- Passives (score 7-8) are satisfied but unenthusiastic customers who are vulnerable to competitive offerings.
- Detractors (score 0-6) are unhappy customers who can damage your brand and impede growth through negative word-of-mouth. To arrive at the final number, you ignore the Passives and calculate the difference between the percentage of the two extreme groups.
At Product People, we’ve seen that the most successful teams don't just look at the final number in a vacuum. During our work accelerating discovery for SevDesk, we emphasized that the quantitative score must be paired with qualitative "Why?" questions to be truly effective. The score tells you where you stand, but the follow-up comments tell you what to fix in your product roadmap. Relying solely on the numerical output without investigating the drivers behind the Detractors can lead to a "vanity metric" trap where the score improves, but the underlying product experience remains stagnant.
Applying the NPS Net Promoter Score Formula in Product Strategy
Once you have gathered your survey responses, you apply the NPS net promoter score formula to generate a value that ranges from -100 to +100. The formal equation is expressed as:
NPS = (% Promoters) - (% Detractors)
For example, if you survey 100 users and find that 70 are Promoters, 10 are Detractors, and 20 are Passives, your score would be $70 - 10 = 60$. It is important to note that the result is displayed as an integer, not a percentage. This simple math allows product organizations to quickly communicate user health to stakeholders without getting bogged down in complex statistical modeling. However, the simplicity of the formula belies the rigor required in data collection, as timing and user segmentation can significantly skew the results.When analyzing your results, it is crucial to understand NPS score ranges to determine where your product sits relative to the market. Generally, any score above 0 is considered "good" because it means you have more Promoters than Detractors. A score above 50 is excellent, and anything above 70 is considered world-class. However, these benchmarks vary wildly by industry; a "good" score for a telecommunications provider might be a "poor" score for a high-growth B2B SaaS platform. According to research from Qualtrics, context is everything: you should prioritize your own historical trends and direct competitor benchmarks over generic industry averages.
In our experience acting as interim product leaders for various European scale-ups, we frequently encounter "Passive" heavy distributions. While the formula ignores these users in the final calculation, a high volume of 7s and 8s represents a significant risk for churn. We worked with a B2B SaaS company that had an NPS of 40, which seemed healthy. However, 50% of their respondents were Passives. By digging into the feedback, we discovered that while the core product worked, the lack of integrations prevented users from becoming NPS Promoters. By shifting the roadmap to prioritize these integrations, we successfully converted a large segment of Passives into Promoters, eventually raising the score to 62 within two quarters. This move not only improved the metric but also measurably increased the lifetime value (LTV) of that user cohort.Effective implementation also requires choosing between "Relationship NPS" and "Transactional NPS." Relationship surveys are sent at regular intervals (e.g., quarterly) to gauge the overall brand health, while Transactional surveys are triggered by specific events, such as completing an onboarding flow or a customer support ticket. For product managers, Transactional NPS is often more actionable because it links the user's sentiment directly to a specific feature or milestone. Regardless of the method, the goal remains the same: use the data to identify friction points and double down on the features that turn average users into vocal advocates. For further reading on the scientific validity of these metrics, the Journal of Service Research offers deep dives into the longitudinal effects of loyalty metrics on firm performance.
FAQs
Conclusion
Calculating your NPS is the first step toward building a truly customer-centric product culture. By mastering the formula and understanding the behavior of your Promoters and Detractors, you gain a clear, quantitative baseline for your user experience efforts.Moving forward, focus on the qualitative "why" behind your scores to drive meaningful product iterations. If you consistently track these metrics and align your roadmap with user feedback, you will transform NPS from a static report into a dynamic tool for sustainable growth.

Interested in working with us?
Our Interim/Fractional Product Managers, Owners, and Leaders quickly fill gaps, scale your team, or lead key initiatives during transitions. We onboard swiftly, align teams, and deliver results.
Read More Posts
June 12, 2026
Customer Lifetime Value: What It Is and How to Grow It
Learn what customer lifetime value is, how to calculate it with the CLV formula, and proven strategies to increase CLV for your SaaS business.

June 24, 2026
Product Development: Process, Lifecycle & Best Practices
Learn what product development is, how the process works, and how agile and MVP approaches help modern teams build better products.

June 23, 2026
20 PM Voices Worth Following on LinkedIn
Discover 20 product management voices worth following on LinkedIn. From Marty Cagan-endorsed authors to PLG experts and product coaches, here are the practitioners actually worth your feed.