

Semantic Differential Scale: How to Measure Perceptions Right
Learn how a semantic differential scale works, when to pick it over a Likert scale, and how to build one that shows how users really perceive your product.


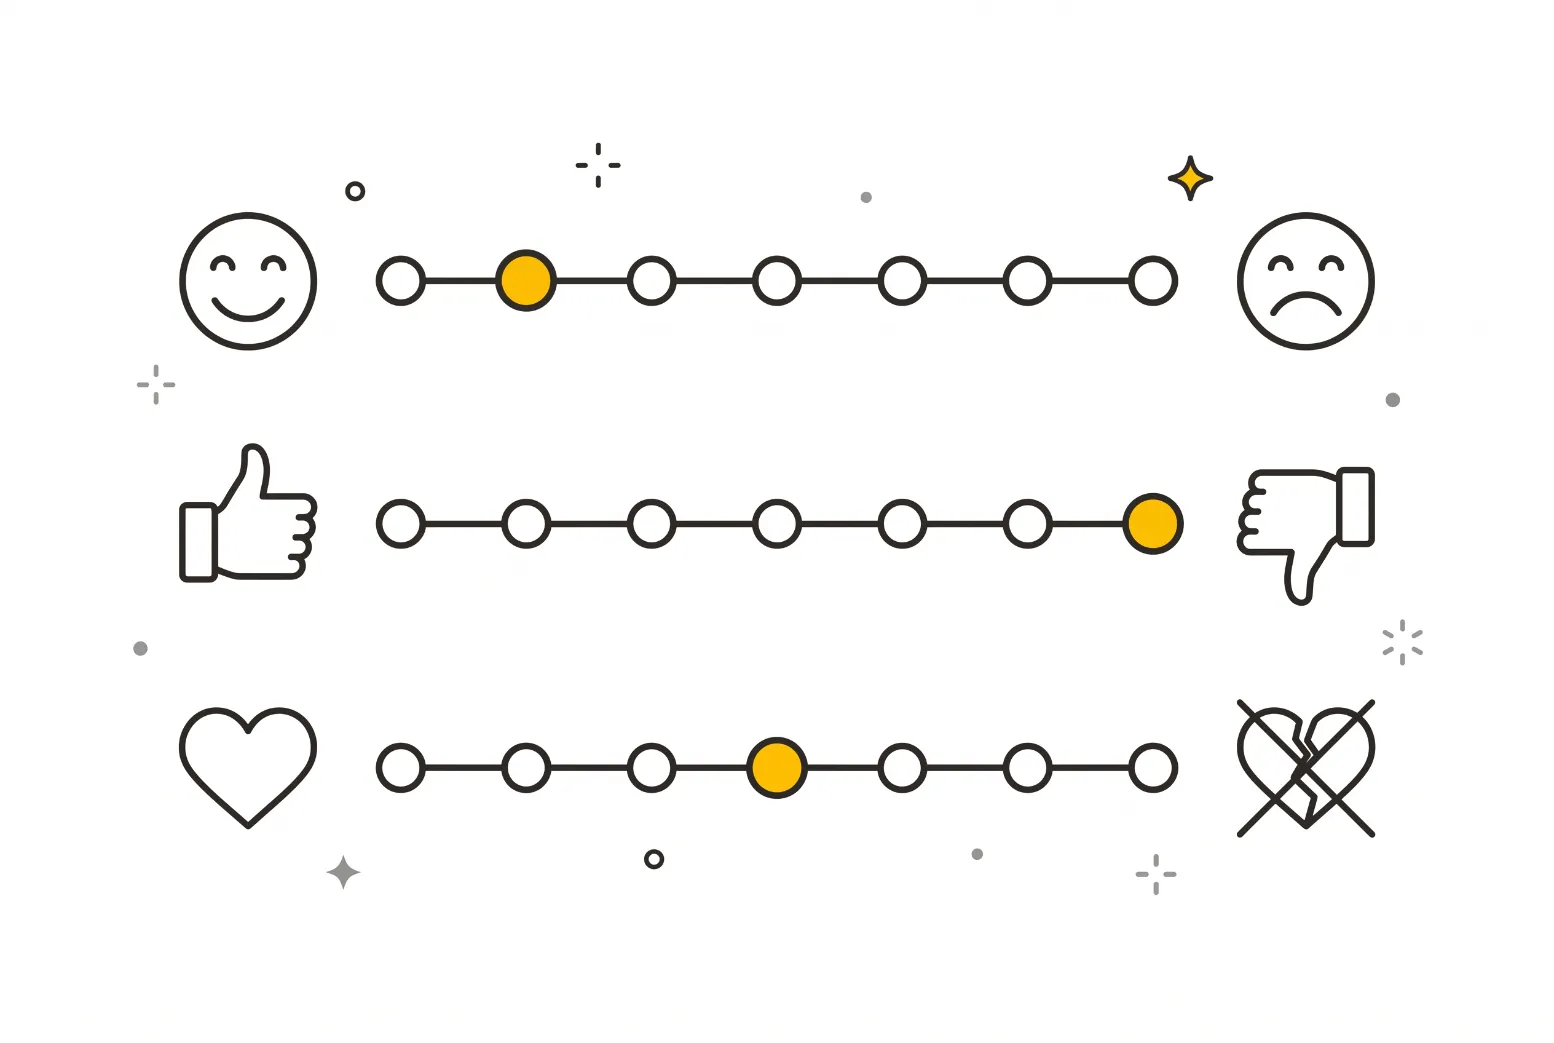
Table of Contents
A semantic differential scale is a survey format that asks people to rate a concept, product, or brand between two opposite adjectives, such as "slow" and "fast." Instead of agreeing or disagreeing with a statement, respondents mark a point on a line that runs from one word to its opposite.
Charles Osgood and his colleagues introduced the method in The Measurement of Meaning, published in 1957. Their goal was to measure connotation, the feeling a concept carries beyond its dictionary definition. That is useful in product work, where the real question is rarely "does it work?" and far more often "how does it feel?" A feature can pass every usability test and still come across as cold, fussy, or cheap.
Most teams reach for a Likert scale by default, and sometimes that is the wrong tool. A quiet argument about the color of a button is a good way to see why.
Semantic Differential vs. Likert Scale in Product Research
A Likert item gives respondents a statement and asks how far they agree with it. Rensis Likert described the approach in his 1932 monograph, A Technique for the Measurement of Attitudes, where people rate statements on an agree-to-disagree range. A semantic differential flips the logic. There is no statement. There are only two poles, and the respondent decides where the thing you are testing sits between them.
Here is the same question asked both ways:
- Likert: "The checkout is easy to use." Strongly disagree to strongly agree.
- Semantic differential: Checkout, rated from "Confusing" to "Clear."
The wording matters more than it looks. A statement carries the author's opinion with it, and respondents tend to drift toward agreement. Two opposite words are harder to lean on, because neither one is the "right" answer. That is the case for the semantic differential when you want to measure perceptions and attitudes toward a concept rather than judge a claim you already wrote.
Here is how the two formats compare:
- Respondent reacts to: a statement (Likert) versus a pair of opposite adjectives (semantic differential).
- Best for: agreement with specific claims (Likert) versus perception, tone, and brand feel (semantic differential).
- Typical points: 5 or 7 (Likert) versus 7 (semantic differential).
- Main risk: leading statements (Likert) versus adjectives that are not true opposites (semantic differential).
Choose Likert when you have a specific claim to test, such as "I could find the export button without help." Choose the semantic differential when you want a profile of how something is perceived: a new onboarding flow, a rebrand, a competitor, your own pricing page. Plenty of teams run both in one survey. Likert items check the functional claims, and bipolar pairs capture the emotional layer that those claims miss.
One caution: neither format is neutral. Both are shaped by who you ask and how you word things, so treat any single result as a signal, not a verdict.
How to Measure Perceptions and Attitudes With Bipolar Pairs
Building a good scale takes less work than building a good interview guide, but it still deserves care. Here is a workable sequence:
- Name the concept you are rating. One scale, one concept. If you want opinions on both your app and your onboarding emails, run two scales.
- Pick 6 to 10 adjective pairs. Osgood's research found that responses cluster around three dimensions: evaluation (good to bad), potency (strong to weak), and activity (active to passive). Include at least one pair from each so you do not only measure whether people like something.
- Check that the pairs are real opposites. "Simple" against "Powerful" is a trap, because a product can be both. "Simple" against "Complicated" is fair.
- Use seven points. Seven is the common convention for this format, and the middle point gives people an honest neutral option.
- Flip the direction of some pairs. If every positive word sits on the left, people start ticking down one side without reading.
- Pilot it on five or six people. Ask them to say what each pair means to them. You will be surprised how often "Bold" reads as "Aggressive."
When the data comes in, average each pair and plot the means as a profile line. The shape tells the story. A product that scores warm and approachable but also unreliable has a different problem than one that scores cold and dependable. Comparing the profile of your product with a competitor's, or your current design with a prototype, is where the format earns its keep.
Pair it with qualitative work. A score tells you that people find a screen "Cluttered," but only a conversation tells you which part. If you are still shaping your feedback habits, this guide on how to collect and actually use customer feedback covers the follow-up loop that turns survey numbers into decisions.
Connotation of the Color Blue: A Semantic Differential Test
Color is a good practice ground because everyone has a strong opinion and almost nobody has data. Picture a product trio arguing over the primary color for a new finance app. The designer wants blue because it feels calm and trustworthy. The PM worries it will look like every other bank. Someone mentions that "feeling blue" means sadness. All three are describing the connotation of the color blue, and all three are guessing.
Research on color is more cautious than the confident folklore. A review by Andrew Elliot, Color and psychological functioning, argues that the meaning of a color depends on learned associations and on the context in which it appears. In other words, the same blue can read as clinical on a medical device and relaxed on a travel site. That is the heart of color blue theory as it matters to product teams: meaning is not built into the hue, so you have to measure it in your own setting.
A semantic differential does exactly that. Show one group the app with a blue palette and another group a green or orange variant, then ask each to rate the product on pairs such as:
- Calm to Tense
- Trustworthy to Untrustworthy
- Warm to Cold
- Modern to Dated
- Premium to Cheap
The meanings for the color blue that matter are the ones your users report, not the ones in a listicle. You may find blue lifts "Trustworthy" while pushing "Cold" higher too, which would tell you the trade you are making. You may also find age groups or markets split. Either way, you now argue from a profile instead of a feeling.
Keep the sample sensible and the comparison clean. Change only the color, show the same screens, and keep the pair order the same across groups. If a finding will drive a costly rebrand, repeat it before you commit.
FAQ
What is an example of a semantic differential scale?
Rating a checkout flow between "Confusing" and "Clear" on a seven-point line. Each item pairs two opposite adjectives, and respondents mark the point that fits.
How is it different from a Likert scale?
A Likert item asks how much someone agrees with a statement. A semantic differential asks where a concept sits between two opposite words.
How many points should the scale have?
Seven is the common default, though five or six also appear. An odd number gives respondents a neutral midpoint.
Does the color blue mean the same everywhere?
Not reliably. Color meanings depend on context and culture, so test them with your own audience instead of assuming.
Conclusion
The semantic differential scale is a small tool with a narrow job: showing how people perceive something rather than whether they agree with what you say about it. Use Likert for claims, bipolar pairs for feel, and always check that your adjectives are real opposites.
Next time a debate about tone, brand, or color stalls a roadmap, write five adjective pairs and run them on real users. If you want help designing research that settles those debates, the team behind Product People's user research service can support it.

Interested in working with us?
Our Interim/Fractional Product Managers, Owners, and Leaders quickly fill gaps, scale your team, or lead key initiatives during transitions. We onboard swiftly, align teams, and deliver results.
Read More Posts
October 7, 2026
Monetized Products: What It Means and How to Plan Yours
A monetized product earns revenue from the value it delivers. Learn how to build a monetization strategy for software and apps, and which model fits.
October 5, 2026
Value Proposition: What It Is and How to Write One That Sells
A value proposition tells a specific customer why your product beats their current option. Learn the meaning, canvas examples, and how to test yours.
October 1, 2026
How to Map and Manage Stakeholders with Mendelow's Matrix
Mendelow's matrix sorts stakeholders by power and interest. Learn the four quadrants, see a worked product example, and avoid the common mapping mistakes.