
Prioritizing the Product Roadmap Using the Kano Model
Learn how to use the Kano model to prioritize your product roadmap. Discover how to categorize features into must-haves, performance needs, and delighters to boost customer satisfaction and drive product growth.


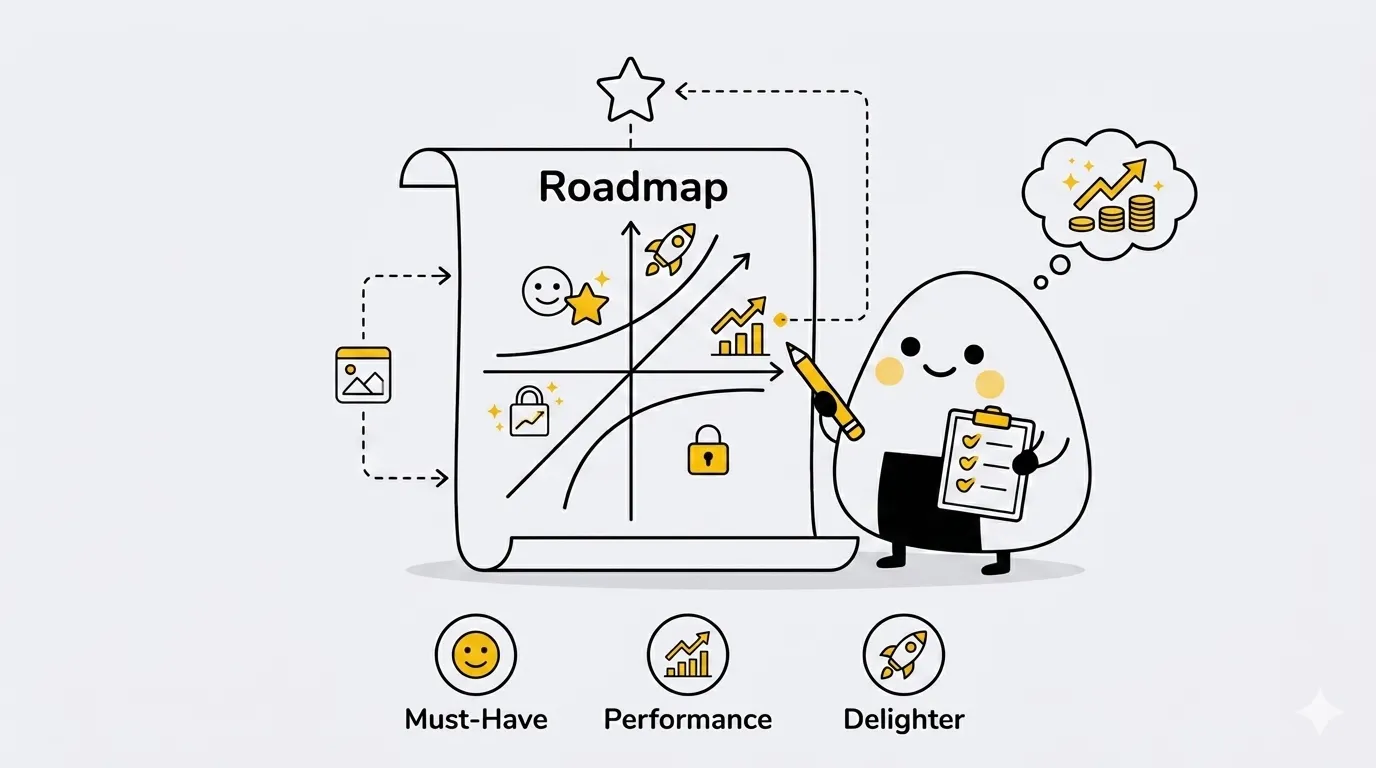
Table of Contents
The Kano model is a robust product development framework used to prioritize features based on how likely they are to satisfy customers. By categorizing potential features into distinct groups—such as basic needs, performance requirements, and excitement generators—product managers can move beyond gut feeling to make data-driven roadmap decisions. This article explores how to implement this framework to balance essential functionality with the "delighters" that differentiate your product in a crowded market. We will cover the mechanics of the methodology, how to analyze user feedback, and practical ways to apply these insights to your current sprint cycles.
Understanding user expectations is often the hardest part of product management because customers rarely know what they want until they see it. The methodology provides a structured way to uncover these latent needs by mapping the relationship between product investment and emotional response. Instead of treating every feature request as equal, you can identify which attributes are "must-haves" and which are "nice-to-haves." This distinction is critical for resource allocation and ensuring that your engineering team focuses on the highest-impact work first.
As you dive deeper into this framework, you will learn how to conduct specific surveys that reveal the functional and dysfunctional value of a feature. We will also look at the lifecycle of a feature, as today’s "delighter" often becomes tomorrow’s "basic expectation." By the end of this guide, you will have a clear blueprint for using this model to refine your product strategy and improve overall user satisfaction.
Mastering Customer Satisfaction with Kano Analysis
Kano analysis serves as a strategic compass for product teams looking to validate their value proposition through the lens of the end user. At its core, this technique requires shifting your mindset from "What can we build?" to "How will this build affect the user’s joy?" To perform this analysis effectively, you must utilize a specific questionnaire format that asks users how they feel if a feature is present versus how they feel if it is absent. This dual-track questioning reveals the true nature of a requirement, distinguishing a "Basic" feature (one that causes extreme dissatisfaction if missing but doesn't increase satisfaction if present) from a "Performance" feature (where more is always better).
The beauty of this approach is that it quantifies qualitative feelings. For instance, in a Kano model example, consider the battery life of a smartphone. If the battery lasts 2 hours, the user is furious; if it lasts 20 hours, they are satisfied. This is a linear relationship. However, a "Delighter" feature, like the first introduction of FaceID, might not have been missed if it didn't exist, but its presence created a massive spike in satisfaction. By plotting these responses on a grid, product managers can visualize the ROI of every line of code. This data is invaluable during stakeholder negotiations, as it provides a neutral, evidence-based argument for why certain features must be prioritized over others to prevent churn.
Implementing this analysis requires a disciplined approach to user research. You should target a representative segment of your user base and present them with a list of 5–10 potential features. For each feature, ask the functional question ("How do you feel if the product has X?") and the dysfunctional question ("How do you feel if the product does not have X?"). The answers—ranging from "I like it" to "I dislike it"—are then mapped to a standardized evaluation table. This process helps you avoid the "feature factory" trap where teams build items simply because they are easy to code, rather than because they solve a core customer pain point.
Visualizing Success Through the Kano Diagram
The Kano diagram is the visual representation of your research findings, mapping "Level of Implementation" on the horizontal axis against "Customer Satisfaction" on the vertical axis. This coordinate system creates a clear picture of where your product stands. On this graph, you will typically see three main curves. The "Must-be" curve stays below the neutral satisfaction line, showing that you can never truly make someone "happy" with a basic requirement—you can only keep them from being unhappy. The "One-dimensional" or Performance curve is a diagonal line where satisfaction increases in direct proportion to the quality of the feature. Finally, the "Attractive" curve rises steeply even with low implementation, representing those "wow" moments that win market share.
Using this visual tool allows product leaders to see the "decay" of features over time. A classic industry observation is that "Attractive" features eventually migrate toward "Must-be" status as technology matures and competitors catch up. For example, high-speed Wi-Fi in hotels was once an excitement generator; today, it is a basic expectation that causes immediate frustration if it is slow or missing. By regularly updating your kano model mapping, you can predict these shifts and innovate before your product feels dated. This proactive strategy is essential for maintaining a competitive edge in fast-moving industries like SaaS or FinTech.
Beyond just categorization, the diagram assists in identifying "Indifferent" features—those that users simply don't care about regardless of how well they are executed. Identifying these is a major win for any product team, as it allows you to cut the fat from your roadmap and stop wasting engineering hours on things that don't move the needle. You might also discover "Reverse" features, where the presence of a function actually decreases satisfaction (such as overly complex security steps). To back these visual strategies with academic and industry rigor, it is helpful to look at the foundational research. The original 1984 study by Noriaki Kano established these categories to help manufacturers improve quality. Further refinement of the methodology in the 1990s bridged the gap between manufacturing and modern service industries. Even today, quantitative approaches to the model continue to be the gold standard for prioritizing requirements in complex systems.
FAQs
Conclusion
The Kano framework is more than just a graph; it is a philosophy of intentional product design. By distinguishing between what users need to function and what they need to feel delighted, product managers can build leaner, more impactful roadmaps. This ensures that every sprint delivers a mix of stability and innovation.
Ultimately, mastering this analysis allows you to stop guessing and start building with confidence. By identifying "Must-be" features to prevent churn and "Attractive" features to drive growth, you create a balanced product that stands the test of time. Start applying these principles today to transform your backlog into a strategic asset.

Interested in working with us?
Our Interim/Fractional Product Managers, Owners, and Leaders quickly fill gaps, scale your team, or lead key initiatives during transitions. We onboard swiftly, align teams, and deliver results.
Read More Posts
July 31, 2026
What Great Product Manager Hiring Actually Looks Like: A Conversation Between Product People & Delivery Hero
Product People and Delivery Hero share what actually predicts a great Product Manager hire, from live case studies to the one interview question worth stealing.
July 30, 2026
Go-to-Market Strategy: Framework, Steps, and Examples
What is a go-to-market strategy? Learn the framework, the building blocks, and a real example before your next launch.
March 25, 2026
Understanding the Modern User to Drive Product Growth
Dive into user experience by moving beyond basic metrics. Learn how to build a robust user persona definition, utilize a professional user persona template, and analyze real-world user persona examples to drive product-led growth and retention.