

Product Stickiness: Definition, Metrics, and How to Improve It
Product stickiness measures how often users return to your product. Learn the DAU/MAU formula, real benchmarks, and how to improve it.


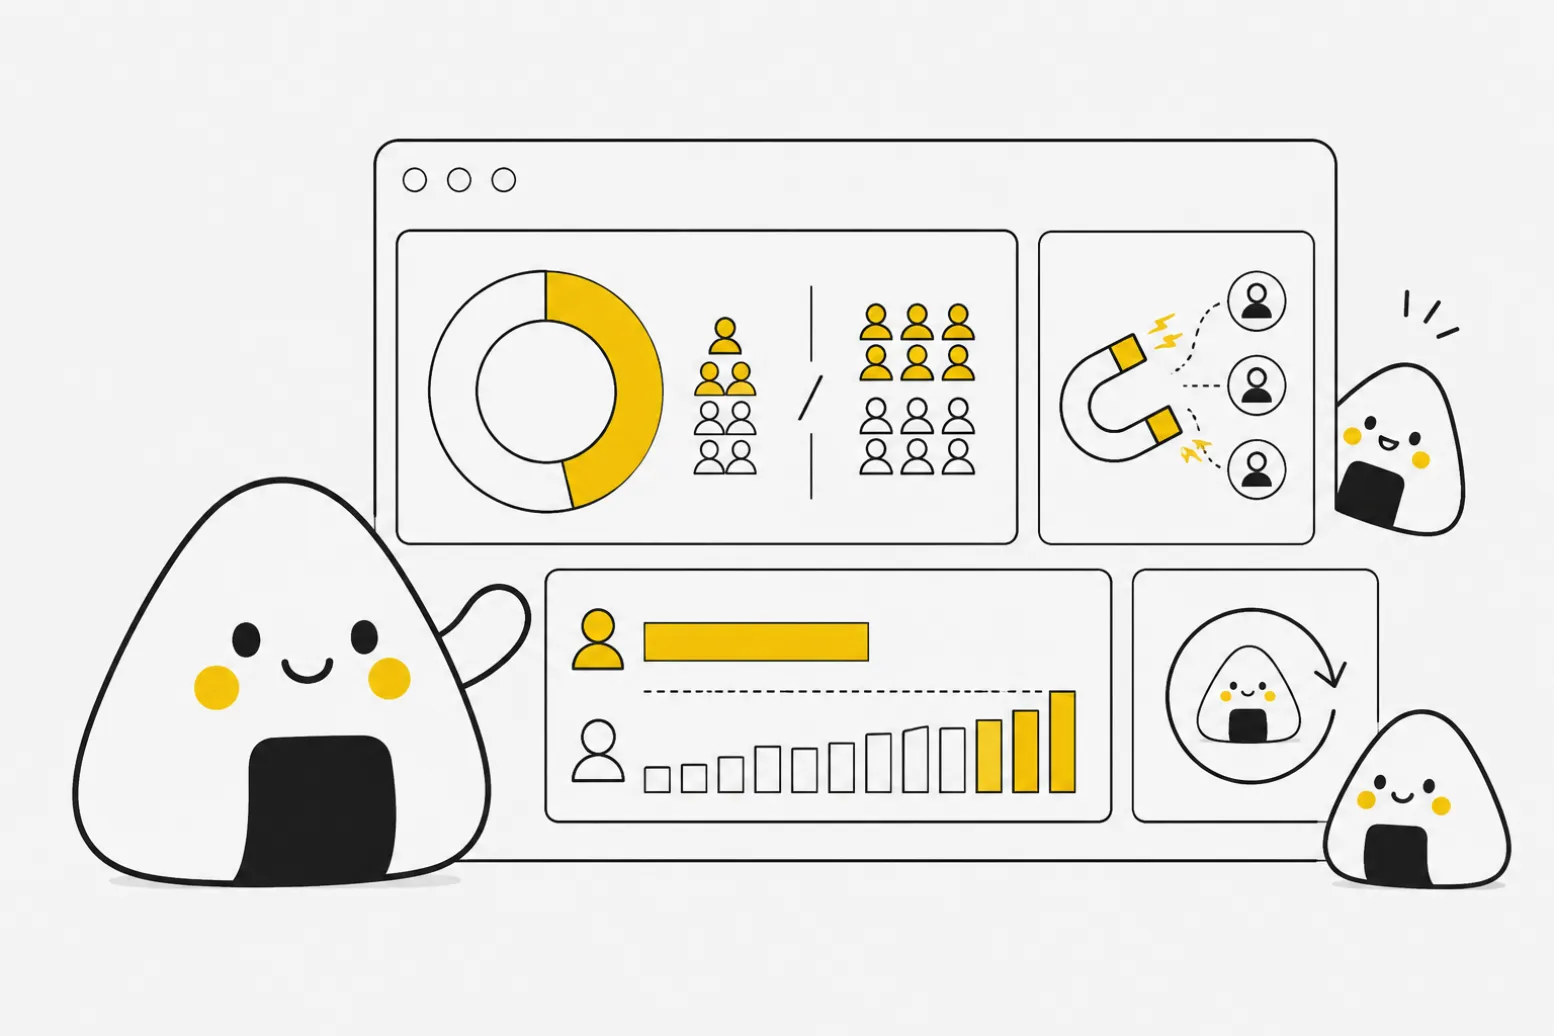
Table of Contents
Product stickiness is how often users come back to your product on their own, without a push notification or email nudging them. It is usually expressed as a ratio of daily active users to monthly active users, and it tells you how deeply your product has become part of someone's routine.
Stickiness is not the same thing as growth or even satisfaction. A product can add new signups every week and still be unsticky if most of those users never return after their first session. That gap is exactly what stickiness metrics are built to expose, and it is why so many product teams track it alongside acquisition and retention rather than in place of them.
Growth without stickiness tends to be expensive and short-lived, since every new cohort churns at roughly the same rate as the last one. This article covers what product stickiness means in practice, how to calculate and benchmark it with the DAU/MAU ratio, and what product teams can actually do to raise it. It closes with answers to the questions people ask most often about the metric.
Stickiness Definition and Why It Matters
The simplest stickiness definition is the frequency of a user's engagement with your product, measured against how many people could be using it. It answers one question: out of everyone who could show up this month, how many show up today?
That framing matters because it separates two things product teams often confuse. Retention tells you whether a user is still around at all after 30, 60, or 90 days. Stickiness tells you how often they engage while they are around. A user can be retained but barely active, logging in once a month just enough to avoid being counted as churned. Stickiness catches that pattern; a raw retention number does not.
Product stickiness matters for three practical reasons.
- It predicts revenue risk. Infrequent usage is often the first sign of churn, showing up months before a cancellation or downgrade.
- It reveals real value, not perceived value. Users who return daily are telling you, through behavior rather than a survey, that the product solves a recurring problem.
- It guides where to invest. Low stickiness in a specific feature or user segment points product teams toward the exact gap worth fixing next.
Stickiness also varies enormously by product category, so a single benchmark rarely applies across the board. A daily habit product like a messaging app should have far higher stickiness than a tool people only need once a quarter, such as tax software. Before judging your own number, first decide what usage cadence your product is actually designed for.
For consulting teams working with clients across categories, this distinction matters as much as the number itself. A client asking why their stickiness ratio looks "low" compared to a consumer social app is usually comparing two products that were never meant to be used at the same frequency in the first place.
User Stickiness and the DAU/MAU Ratio
The standard way to calculate user stickiness is the DAU/MAU ratio: divide daily active users by monthly active users over the same period, then express the result as a percentage. If a product has 20,000 daily active users and 100,000 monthly active users, its stickiness ratio is 20%.
That 20% means one in five monthly users shows up on a typical day, or roughly six days out of thirty. A ratio of 50% means users are engaging about every other day. Ratios above 70%, the range associated with products like WhatsApp or Instagram, signal that a product has become a near-daily habit.
Benchmarks differ sharply by category. Mixpanel's 2024 Benchmarks Report, built from more than 11 trillion product events, found regional stickiness ratios clustering between roughly 20% and 30% across most digital products, with notable variation by industry and geography. Social and messaging apps tend to sit at the high end of that range, while B2B and fintech products often land lower simply because the underlying use case does not require daily engagement.
A few practical notes on calculating this correctly:
- Use average DAU across the period, not a single day's number, to smooth out weekday effects.
- Define "active" consistently, ideally around a meaningful action rather than a login.
- If your product has a weekly rather than daily rhythm, calculate DAU/WAU instead so the ratio reflects the cadence you actually expect.
Getting the "active" definition wrong is the most common mistake teams make with this formula. Counting a login as active inflates the ratio and hides the fact that users are not actually engaging with anything of value once they arrive. For teams that want to go deeper on the daily active user side of this formula, our guide on what DAU means and how to track it walks through these measurement mistakes in more detail.
Stickiness Measurement: Ways to Improve It
Measuring stickiness well means going beyond the headline DAU/MAU number. Segment it by cohort, plan tier, and individual feature so you can see which parts of the product are pulling the ratio up and which are dragging it down. A single blended stickiness score can hide a healthy core feature next to an unused one.
Once you know where stickiness is weak, a few levers consistently move the number.
- Fix onboarding first. Users who never reach the product's core value in their first session rarely become daily users later. A strong first-run experience does more for stickiness than any feature shipped months in.
- Build habit loops around a clear trigger. The products with the highest stickiness ratios attach usage to something that already happens daily, like a calendar check or a morning review.
- Let usage compound. Products that get more useful as a person invests time in them, through saved data, custom views, or accumulated history, create a real reason to return that a static feature list cannot.
- Personalize the return visit. Surfacing what changed since a user's last session gives them a reason to open the product again today rather than next week.
Improving stickiness is closely tied to broader retention work, and the two efforts should share the same measurement discipline. Our breakdown of customer retention formulas and benchmarks is a useful next step once you have your stickiness baseline in place.
It is worth treating any external benchmark as directional rather than a target to hit exactly. Harvard Business Review Analytic Services' report on modern customer engagement found that while 92% of business leaders view customer engagement as critical to their success, only 9% rate their own engagement as excellent, a gap that shows up in product usage data long before it shows up in revenue. Amplitude's Product Benchmark Report, based on behavioral data from more than 2,600 companies, found that the top 10% of products accounted for 79% of all user engagement, growing active users at 7.5% a month versus under 1% for the median, making it a useful companion source for benchmarking your stickiness and engagement against peers.
FAQ
Conclusion
Product stickiness is a behavioral check on whether your product has earned a place in someone's routine, not just a signup. The DAU/MAU ratio gives you a simple number, but it only becomes useful once you segment it by feature and cohort against a benchmark that matches your product's usage cadence.
If you have not calculated your own stickiness ratio yet, start there before chasing an external benchmark. Once you have a baseline, prioritize the onboarding and habit-loop fixes most likely to move it, then track it alongside retention rather than as an isolated metric.

Interested in working with us?
Our Interim/Fractional Product Managers, Owners, and Leaders quickly fill gaps, scale your team, or lead key initiatives during transitions. We onboard swiftly, align teams, and deliver results.
Read More Posts
October 15, 2026
Lean Canvas: What It Is and How to Fill It Out Step by Step
A lean canvas is a one-page plan that turns your startup idea into testable assumptions. See the template, the nine boxes, and how to fill it out.

October 12, 2026
Semantic Differential Scale: How to Measure Perceptions Right
Learn how a semantic differential scale works, when to pick it over a Likert scale, and how to build one that shows how users really perceive your product.

October 9, 2026
Let the numbers do the talking
Senior leaders talk numbers. How to justify roadmap decisions with business impact, and which guardrails tell you when to skip the analysis.